Writing Scientific Computing Applications
Last Updated: 28, September 2020 at 11:21:33
Platform tools: dune
Overview
Data science applications are typically written in Python thanks to the large community providing excellent libraries for nearly any area of analysis. OCaml can offer concise, fast and crucially type-safe code in the scientific computing arena. Thanks to ongoing work by Liang Wang et al. OCaml now has the Owl scientific computing library.
What follows are some brief examples to give you a taste of scientific computing in OCaml. If you like what you see, then the next stop for you is the amazing OCaml Scientific Computing book.
Recommended Workflow
Introduction to Owl
Owl is a library for running scientific computations in OCaml. Besides providing a base of useful functions for manipulating data, Owl has the difficult task of managing memory efficiently in a functional language like OCaml. Using a computation graph, Owl can perform operations lazily and help reduce how much memory is allocated.
The most ubiquitous data type is the Ndarray (n-dimensional array).
open Owl.Dense
module IntArr = Ndarray.Generic

let () =
  let open Owl.Arr in
  let arr1 = Ndarray.Generic.ones Int64 [| 5; 5 |] in
  let arr2 = Ndarray.Generic.ones Int64 [| 5; 5 |] in
  Ndarray.Generic.pp_dsnda Format.std_formatter (arr1 + arr2)
Note we locally open Owl.Arr in order to get the infix array addition operator.
$ dune exec -- ./main.exe

   C0 C1 C2 C3 C4
R0  2  2  2  2  2
R1  2  2  2  2  2
R2  2  2  2  2  2
R3  2  2  2  2  2
R4  2  2  2  2  2
Using and reading datasets
Implementing algorithms for processing and inferring interesting results from data is only part of scientific computation. Another larger part is simply reading, cleaning and showing the data.
There are some useful functions like Owl.Dataset.download_all to be able to download and then use common datasets like the MNIST dataset -- this part of the book explains that part well.
For using different datasets probably the most common format is comma-separated values (CSVs). Owl comes with utility functions to make using CSVs easy. Consider this small dataset:
language,url,kind
OCaml,https://ocaml.org,multiparadigm
Haskell,https://www.haskell.org/,functional
Using the Dataframe module we can load this file as a dataframe, and the Owl_pretty function makes it easy to inspect the data.
open Owl

let () =
  let open Dataframe in
  let csv = of_csv "data.csv" in
  Owl_pretty.pp_dataframe Format.std_formatter csv;
  (* Print the first row's kind *)
  Format.(
    fprintf std_formatter "\n==== %s ====" (unpack_string csv.%((0, "kind"))));
  let is_functional arr = function "functional" -> Some arr | _ -> None in
  let keep_functional =
    filter_map_row (fun arr -> is_functional arr (unpack_string arr.(2))) csv
  in
  Owl_pretty.pp_dataframe Format.std_formatter keep_functional
Finally we can run this example:
$ dune exec -- ./main.exe

  +--------+------------------------+-------------
   language                      url          kind
  +--------+------------------------+-------------
R0    OCaml        https://ocaml.org multiparadigm
R1  Haskell https://www.haskell.org/    functional

==== multiparadigm ====

  +--------+------------------------+----------
   language                      url       kind
  +--------+------------------------+----------
R0  Haskell https://www.haskell.org/ functional
The dataframe module is very useful for exploring the data and is similar to the same structure found in the very popular python pandas library.
In the example you can see different functions being used like the .%() which extracts a row and column based on the index and label provided. The filter_map_row shows how one might go about cleaning data by removing unwanted rows (for example those with N/A values).
Basic Scientific Computing Tasks and Plotting
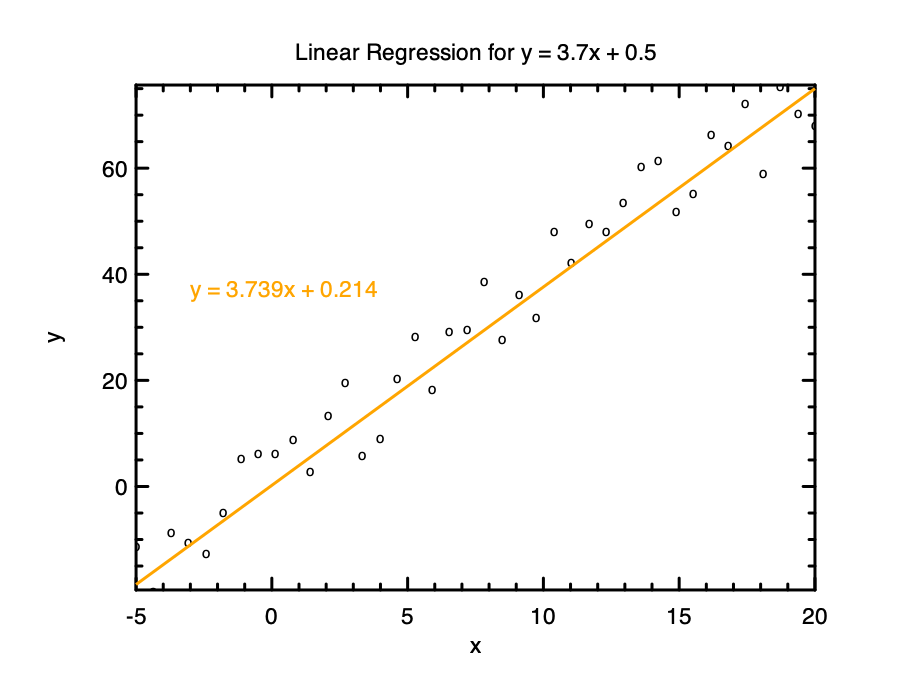
As a final, small example to give you a taste of doing scientific computing in OCaml we'll compute a simple linear regression. We'll define a simple function f that is really a straight line (mx + c) with a little randomness thrown in. Then we'll try and find the parameters m and c that best fit the function using linear regression.
Again, the owl book has a brilliant chapter on different forms of regression and treats the topic much more rigorously.
A linear regression involves trying to model a function by taking a linear combination of variables, in this example we keep it simple with only one independent variable as well as a constant parameter. We can then construct a "cost function" for determining how wrong our model is compared to our training data and try to minimise that error using standard methods like gradient descent, all of which Owl generously provides.
let () =
  (* The parameters we will try to guess *)
  let m = 3.7 in
  let c = 0.5 in
  let h = Plot.create "linreg.png" in
  (* The function with some randomness *)
  let f = f ~randomness:20. m c in
  let line m c x = (m *. x) +. c in
  Plot.set_title h
    ( "Linear Regression for y = " ^ string_of_float m ^ "x + "
    ^ string_of_float c );
  Plot.set_font_size h 8.;
  Plot.set_pen_size h 3.;
  (* Generating training and plotting data *)
  let xs_train, xs_plot =
    (Mat.linspace (-5.) 20. 1000, Mat.linspace (-5.) 20. 40)
  in
  let ys_train, ys_plot = (Mat.map f xs_train, Mat.map f xs_plot) in
  (* Scatter plot the plotting data *)
  Plot.scatter ~h ~spec:[ Marker "o" ] xs_plot ys_plot;
  (* Use the built-in linear regression (on doubles) *)
  let c, m = Linalg.D.linreg xs_train ys_train in
  (* Our guess *)
  let guess = line m c in
  Plot.plot_fun ~h ~spec:[ RGB (255, 165, 0) ] guess (-5.) 20.;
  Plot.set_font_size h 6.;
  Plot.(
    text ~h
      ~spec:[ RGB (255, 165, 0) ]
      (-3.)
      (guess 10. -. 0.2)
      ( "y = "
      ^ string_of_float (round3dp m)
      ^ "x + "
      ^ string_of_float (round3dp c) ));
  Plot.output h
We use the plotting functionality that Owl provides opening Owl_plot.